The e-Design DSO203 (sometimes referred to as the DSO Quad) is a great little portable oscilloscope for budget hobbyists and field work. It’s compact, runs on battery power, and offers 2 analog inputs, 2 digital outputs, and a waveform generator (although it only comes with 2 probes for some reason). However, it’s featureset is a little limited for analysing digital signals; the native firmware has no onboard signal decoding, it cannot be used as a live USB logic analyser, and none of the formats that it can export waveforms in are compatible with standard logic analysis software.
A couple of third party firmwares attempt to address this: Petteri Aimonen’s Logic Analyzer app, and the Wildcat replacement firmware.
Wildcat is a great solution on paper, offering better triggering, a plethora of new view modes (such as X/Y and persistent display), and onboard decoders for SPI, I2C, and TTL. However, it takes up 2 app slots, overwrites the stock firmware, and, in my opinion, is way too clunky and unwieldy.
Logic Analyzer works great for capturing large amounts of data with gaps in between, and exports a standard VCD file. It can even capture up to 2kB of serial data in a single recording! Sounds great right? Well, here’s the thing (because there’s always a thing): it can only sample at a max of 500kHz, as opposed to the 72MHz of the native firmware. This means it can be used for slow protocols like I2C and TTL, but the moment you want to use it with most SPI devices, for example, you’re out of luck.
Needing something that could offer high sample rates and compatibility with PC software, I took a closer look at the stock firmware.
The Stock Firmware’s CSV Option
When I said that stock firmware outputs could not be read by PC software, that was a little misleading. The stock firmware can output a CSV file, it just isn’t formatted in a way that any of the software I tried would accept. Here’s the beginning of one of these CSV files:
TRACK1 ,TRACK2 ,TRACK3,TRACK4,
154,108,060,010,
154,108,060,030,
154,108,060,030,
152,108,060,030,
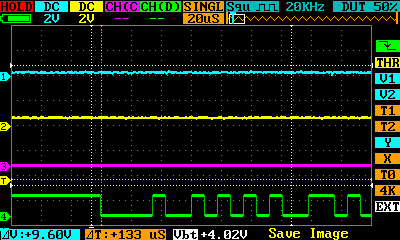
154,107,060,030,Keep in mind that channels A and B are floating (no probes are plugged into them), channel C is low, and channel D is high (as if you could figure that out from these values). You see, those numbers represent Y positions of pixels on the scope’s display, not actual values of any sort. This is excellent for reproducing how everything lined up on screen, but not so great for, you know, actually analysing digital signals. In addition, the channels are called tracks and labeled numerically (the physical ports are labeled alphabetically), TRACK1 and TRACK2 have spaces after them, and there is an accidental blank column caused by the comma after each line.
Cleaning up the CSV
After some testing and prototyping in Jupyter, I put together a web-based converter that can clean these files up for use in logic analysis programs such as Sigrok (and the accompanying PulseView GUI). Here’s that same example file, after conversion:
CH_A,CH_B,CH_C,CH_D
1,1,0,0
1,1,0,1
1,1,0,1
0,1,0,1
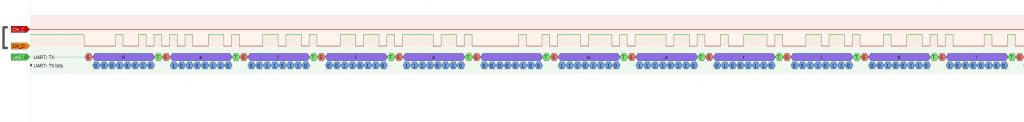
1,1,0,1Ah, much better. The channels are properly labeled, and everything is either a 0 for low or a 1 for high. A value is considered “high” if it’s above the mean reading of that channel. Importing this into PulseView works as expected:
The whole thing is done using Flask, with this simple function handling the actual processing:
def process_csv(csv_in):
    scope_data = pd.read_csv(StringIO(csv_in))
    scope_data = scope_data.dropna(how='all', axis=1)
    scope_data.columns = ['CH_A', 'CH_B', 'CH_C', 'CH_D']

    binary_data = pd.DataFrame()
    for channel in scope_data.columns:
        midpoint = (scope_data[channel].max() + scope_data[channel].min())/2
        binary_data[channel] =  np.where(scope_data[channel]>midpoint, 1, 0)

    return binary_data.to_csv(index=False)
Is it really necessary to use Pandas and NumPy for a job this simple? Probably not. But I still love how clean and fast this solution is, especially compared to the original script I wrote before I knew about Pandas, which worked purely using str.split() and lists.